Tipos de gráficos y funciones ejecutables – Casio ClassPad fx-CP400 Manual del usuario
Página 277
Apéndice 277
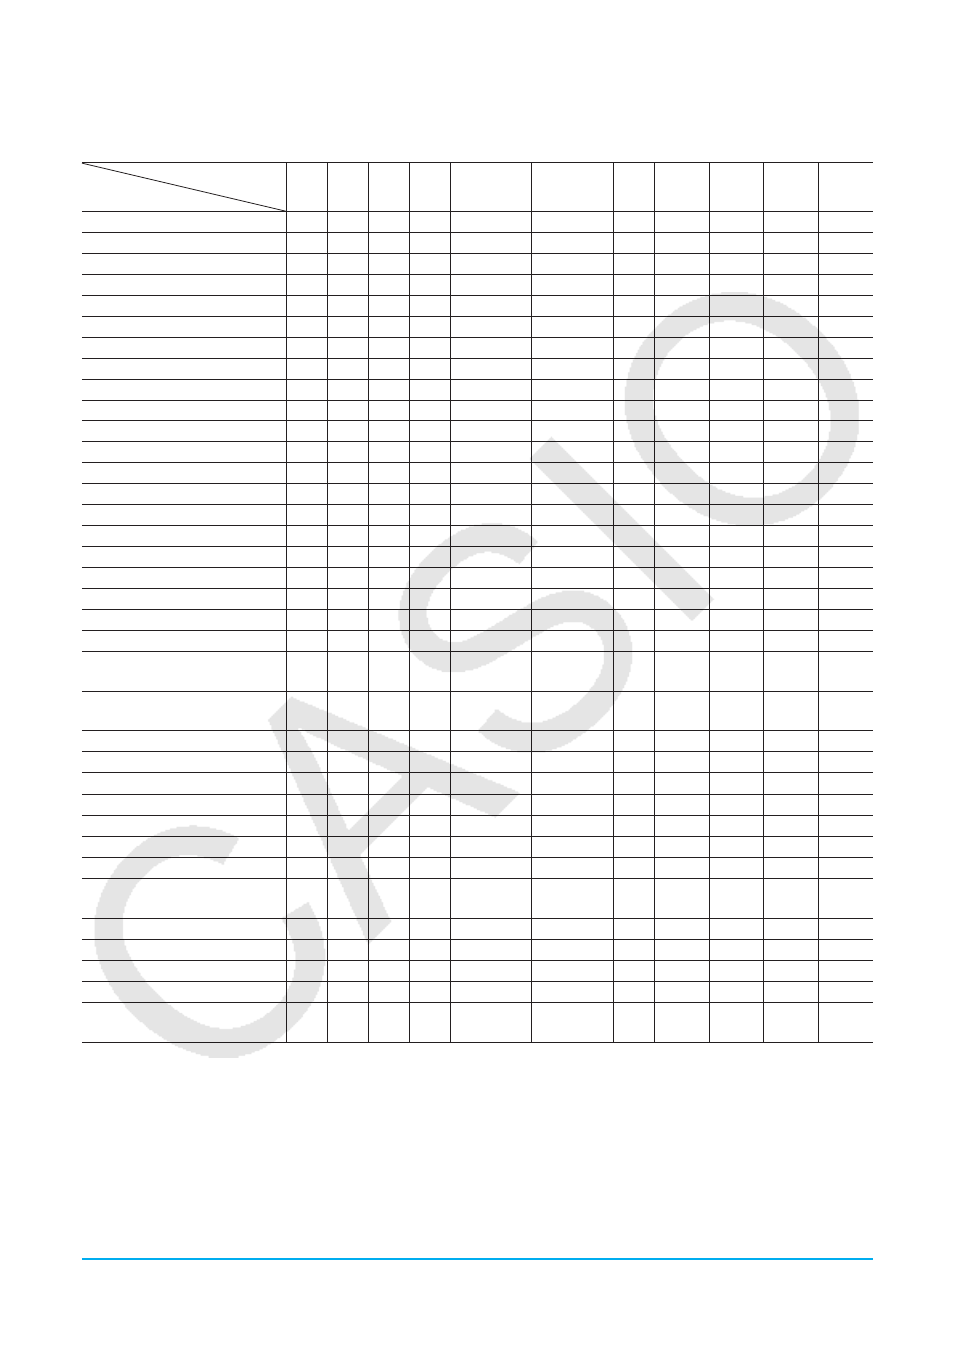
Tipos de gráficos y funciones ejecutables
᭺: Ejecutable −: No ejecutable
Tipo de gráfico
Función
y
=
r
=
xt
=
x
=
y
Inequality
x
Inequality
y
᭜ Conics*
1
Stat -
Plot*
2
Stat -
Reg*
3
Stat -
Box*
4
Zoom - Box
᭺
᭺
᭺
᭺
᭺
᭺
᭺
᭺
᭺
᭺
᭺
Zoom - In
᭺
᭺
᭺
᭺
᭺
᭺
᭺
᭺
᭺
᭺
᭺
Zoom - Out
᭺
᭺
᭺
᭺
᭺
᭺
᭺
᭺
᭺
᭺
᭺
Zoom - Auto
᭺
᭺
᭺
᭺
᭺
᭺
᭺
᭺
−
−
−
Zoom - Original
᭺
᭺
᭺
᭺
᭺
᭺
᭺
᭺
᭺
᭺
᭺
Zoom - Square
᭺*
5
᭺*
5
᭺*
5
᭺*
5
᭺*
5
᭺*
5
᭺*
5
᭺*
5
᭺*
5
᭺*
5
᭺*
5
Zoom - Round
᭺*
6
᭺*
6
᭺*
6
᭺*
6
᭺*
6
᭺*
6
᭺*
6
᭺*
6
᭺*
6
᭺*
6
᭺*
6
Zoom - Integer
᭺*
6
᭺*
6
᭺*
6
᭺*
6
᭺*
6
᭺*
6
᭺*
6
᭺*
6
᭺*
6
᭺*
6
᭺*
6
Zoom - Previous
᭺
᭺
᭺
᭺
᭺
᭺
᭺
᭺
᭺
᭺
᭺
Zoom - Initialize / Quick types
᭺*
6
᭺*
6
᭺*
6
᭺*
6
᭺*
6
᭺*
6
᭺*
6
᭺*
6
᭺*
6
᭺*
6
᭺*
6
Analysis - Trace
᭺
᭺
᭺
᭺
᭺
᭺
᭺
᭺
᭺
᭺
᭺
Analysis - Sketch - Cls
᭺
᭺
᭺
᭺
᭺
᭺
᭺
᭺
᭺
᭺
᭺
Analysis - Sketch - Plot
᭺
᭺
᭺
᭺
᭺
᭺
᭺
᭺
᭺
᭺
᭺
Analysis - Sketch - Line
᭺*
6
᭺*
6
᭺*
6
᭺*
6
᭺*
6
᭺*
6
᭺*
6
᭺*
6
᭺*
6
᭺*
6
᭺*
6
Analysis - Sketch - Text
᭺
᭺
᭺
᭺
᭺
᭺
᭺
᭺
᭺
᭺
᭺
Analysis - Sketch - Tangent
᭺
᭺
᭺
᭺
᭺
᭺
᭺
−
−
᭺
−
Analysis - Sketch - Normal
᭺
᭺
᭺
᭺
᭺
᭺
᭺
−
−
᭺
−
Analysis - Sketch - Inverse
᭺
−
−
᭺
−
−
−
−
−
᭺
−
Analysis - Sketch - Circle
᭺*
6
᭺*
6
᭺*
6
᭺*
6
᭺*
6
᭺*
6
᭺*
6
᭺*
6
᭺*
6
᭺*
6
᭺*
6
Analysis - Sketch - Vertical
᭺
᭺
᭺
᭺
᭺
᭺
᭺
᭺
᭺
᭺
᭺
Analysis - Sketch - Horizontal
᭺
᭺
᭺
᭺
᭺
᭺
᭺
᭺
᭺
᭺
᭺
Analysis - G-Solve -
x
-Cal/
y
-Cal -
x
-Cal
᭺
᭺
−
−
᭺
−
−
᭺
−
−
−
Analysis - G-Solve -
x
-Cal/
y
-Cal -
y
-Cal
᭺
᭺
᭺
−
᭺
−
−
᭺
−
−
−
Analysis - G-Solve - Root
᭺
−
−
−
᭺
−
−
−
−
−
−
Analysis - G-Solve - Min / Max
᭺
−
−
−
᭺
−
−
−
−
−
−
Analysis - G-Solve -
f
Min /
f
Max
᭺
−
−
−
᭺
−
−
−
−
−
−
Analysis - G-Solve -
y
-Intercept
᭺
−
−
−
᭺
−
−
᭺
−
−
−
Analysis - G-Solve - Intersection
᭺
−
−
−
᭺
−
−
−
−
−
−
Analysis - G-Solve - Integral -
∫
dx
᭺*
6
−
−
−
−
−
−
−
−
−
−
Analysis - G-Solve - Integral - Root
᭺*
6
−
−
−
−
−
−
−
−
−
−
Analysis - G-Solve - Integral -
Intersection
᭺*
6
−
−
−
−
−
−
−
−
−
−
Analysis - G-Solve - Inflection
᭺
−
−
−
᭺
−
−
−
−
−
−
Analysis - G-Solve - Distance
᭺
᭺
᭺
᭺
᭺
᭺
᭺
−
−
−
−
Analysis - G-Solve -
π ∫
f
(
x
)
2
dx
᭺*
6
−
−
−
−
−
−
−
−
−
−
Analysis - Modify
᭺
−
−
−
−
−
−
−
−
᭺
−
᭜ - Dynamic Graph (Dynamic
Modify)
᭺
᭺
᭺
᭺
᭺
᭺
᭺
−
−
−
−
*1 Los comandos ResoluciónG de gráficos de cónicas especiales siguientes pueden utilizarse cuando se dibujan gráficos de cónicas.
Focus, Vertex, Directrix, Symmetry, Latus Rectum Length, Center, Radius, Asymptotes, Eccentricity,
x
-Intercept
*2 Los siguientes gráficos estadísticos: Scatter, Histogram,
xy
Line, Broken, NPPlot
*3 Los siguientes gráficos estadísticos: NDist, LinearR, MedMed, QuadR, CubicR, QuartR, LogR, ExpR, abExpR, PowerR, SinR,
LogisticR
*4 Los siguientes gráficos estadísticos: MedBox, ModBox
*5 No se puede ejecutar durante un dibujo de gráfico semilogarítmico (cuando un gráfico se dibuja mientras el cuadro de marcación de
logaritmo
x
o
y
solamente se selecciona en el cuadro de diálogo de la ventana de visualización).